This Knowify deep dive training webinar covers Reporting and Tags, with a walkthrough led by Terrin Kalian (Head of Customer Experience). The session breaks down how tags can help you organize jobs (by location, job type, team, or any structure that fits your workflow) and then how you can use those tags to filter both job views and reports for faster, more relevant insight.
Terrin also demonstrates the difference between project-level reporting (within a single job: budget vs. cost, billing, profitability) and account-wide reporting (across all jobs and transactions), including a clear explanation of how Work In Progress (WIP) works in Knowify and how it’s used to understand under/over-billing over a defined time period.
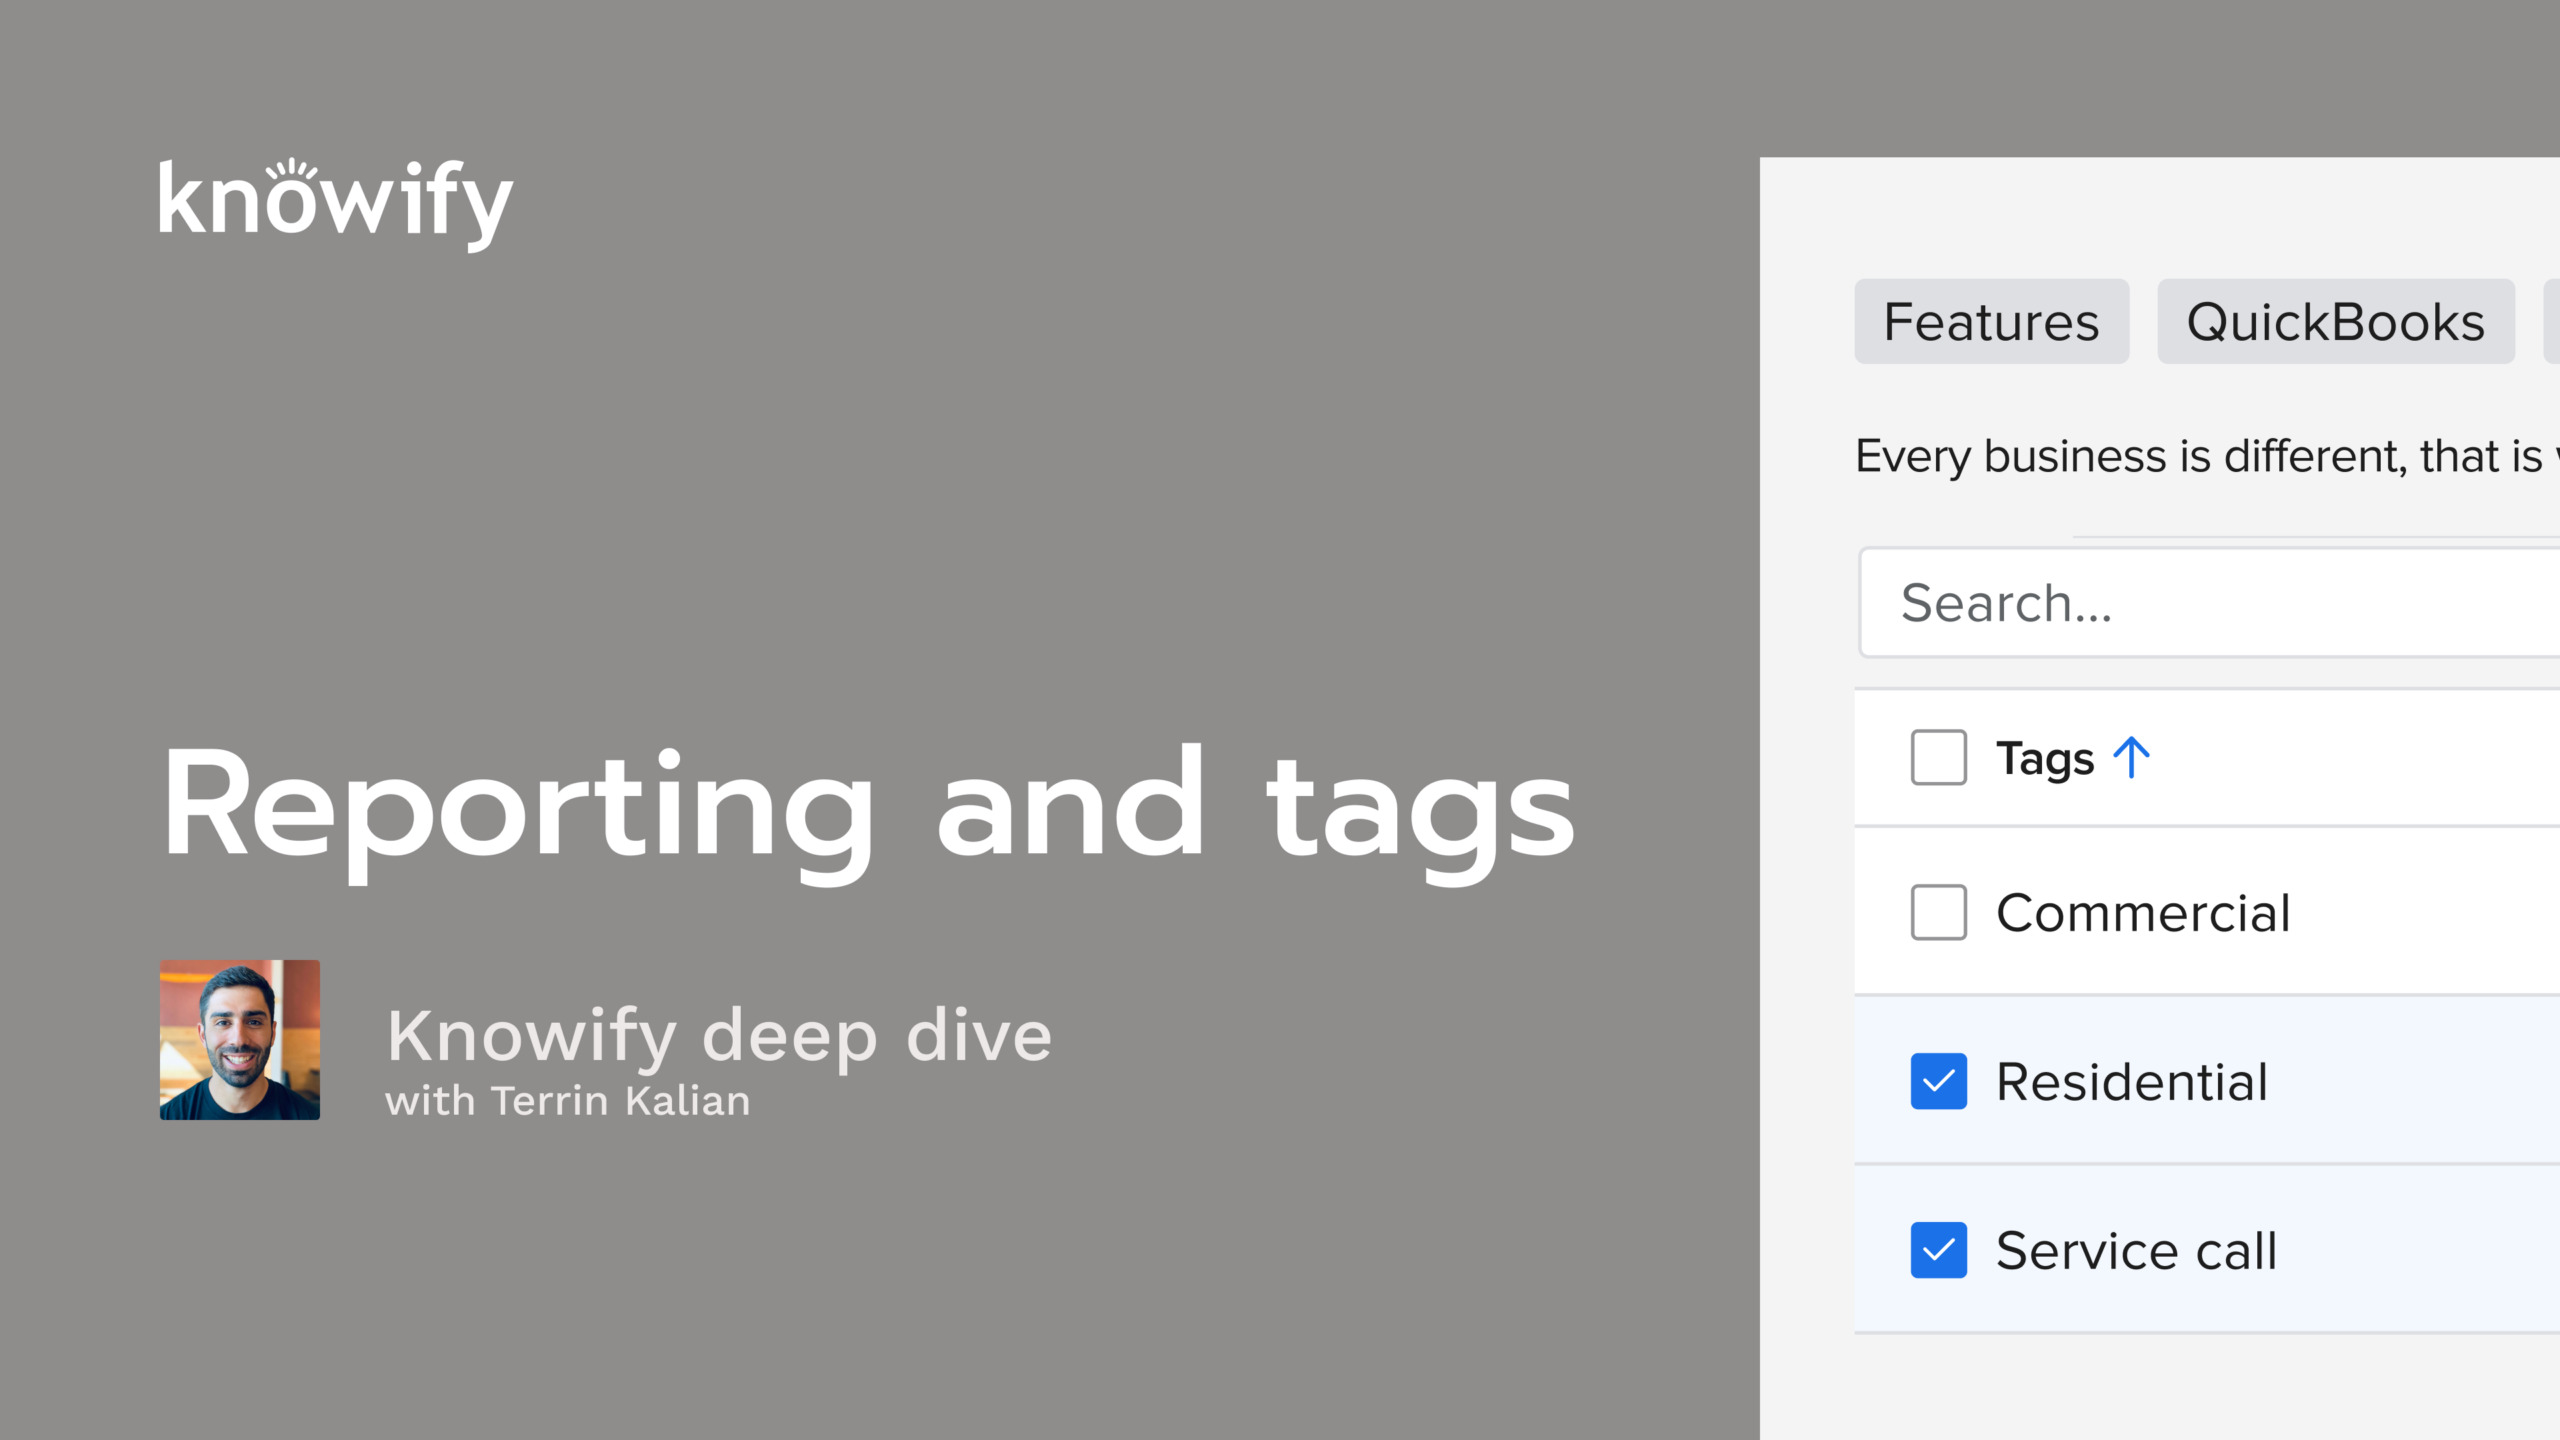
Tags = flexible organization: Use tags to classify jobs (location, type, crew/work category, etc.) and filter views and reports to what matters right now.
Tag governance matters: Create tags on the fly, but manage/merge/delete them in Admin to avoid duplicates and keep your tag list clean; optionally restrict tag creation to admins.
Two reporting layers: Understand the difference between project-specific reporting (inside a job: budget vs. cost, profitability, billing status) and account-wide reporting (across all jobs and transactions).
Customize reports for clarity: Use the gear/settings icon to select columns, simplify outputs, and export to Excel for pivots/averages/rollups (e.g., profitability by PM).
Use item-level transaction reports: Bill Items and Invoice Items reports add the granular detail you can’t always see on bill/invoice summary reports.
WIP is time-based and expectation-setting: WIP reports show how cost/revenue changed in a chosen period and help interpret under/over-billing vs. budget, so you don’t mistake early invoicing for true final profit.
Okay. That makes the top of the hour. So I'm gonna go ahead and get us kicked off. Appreciate everyone joining in today as always. It's always nice to see that people are interested enough in Noify to take some time out of their day and learn a little bit more how to use it. Obviously, we build Noify for you guys, but if you're not getting full use out of the subscription, then, you know, we we wanna learn more about what we can do better. But these sections really are just made to here to make sure that you're getting the most out of every send you pay for Nollify. So thanks for joining in. We're happy to teach you more. Today's topic is on reporting and tags. So if you're unfamiliar with this webinar series, every session, we do a little bit of a more in-depth dive into individual topics inside nullify. And we do have a lot of people who ask us questions about reporting, about using things like tags in nullify. And so this is actually a new topic that's outside our usual rotation. Hopefully, it does well and you guys learned something. We can make it a regular session that we start throwing in here. But we're gonna be discussing the idea of different types of reports that exist, how we can get the most out of reports in Notify, and how we can use our tags to be a little bit more organized inside Notify. If you aren't familiar with me, my name is Terry, and I manage customer experience. So that really just means that I'm, in charge of making sure that, you are getting the most out of your experience with Noify. So, you'll definitely chat with me a lot if you have product feedback. Sometimes I'll, jump in on calls with sales with our success or support team just to see where I can help out, but mostly just based off of, my ten plus years working with Noify. I've seen just about every case that we have and, do everything I can to help out with, customers having a positive experience with Noify. Just a quick overview of our agenda today. I always start out with slides, so I'll cover some concepts like what are tags in Noify and then how to create and manage them, and then really just how to use them inside our Knowify account, how to get use out of them. Then I'll pull up different types of reporting. In Knowify, we have project specific reporting, which is something like what's the breakdown of my cost in this project? But then we have advanced reporting or account wide reporting, which is, across my projects. What are the what's cost versus budget across each of them? You know, what do I have outstanding, on a project by project basis? Things like that, end up being relevant as well. And I'll pull up my Notify account to give you a demonstration of how all of this works so, you could see it a little bit more in person, and then we'll do a q and a at the end just to make sure that we answer as many questions as you have. If you, have questions during this, again, you can throw them in Zoom's q and a. I'll answer a lot of them at the end. And I have my associate, Vin, who, jumps on these calls and answers some of the questions, that are maybe unrelated to the topic or things like that, through the section as well to make sure that we get as many of your questions answered as possible. Okay. Sorry. Go ahead and kick this off with what are tags and what are they used for. So tags in nullify, are in a sense a a pretty abstract concept. They can be used for a variety of different things, and they're really up to you how you like to use them in your nullify account. So there's never really a right and wrong way to use them, But I always like to use a couple of different examples of things like classification of jobs. You know, is this one of our residential or one of our commercial jobs or different types of work? Is this a job where we're doing weatherproofing? Is it exterior? Is it interior? Things like that. This way, we can separate out these different types of project, however we define them, and get our reporting a little bit more specific and get our job management a little bit more specific to these different types of categories, classifications, locations, whatever they seem to be for you in your specific account. And, again, they'll come into play when we're doing things like organizing our jobs in Noify. I wanna see just my commercial jobs right now. I wanna see just my jobs from the New York office, things like that. But they'll also be used for, like I mentioned earlier, reporting inside NoFi and can be used for things like connecting to QuickBooks classes, locations, and if you're on IES dimensions eventually, so that we can, basically have these tags represent more than just, oh, I called this a Denver project. You'll really get some more use out of everything that we're tagging here. Now we can create tags pretty quickly and easily by just entering a new tag on a job. So I create a new job. I say add a tag. If I write something that hasn't been used before, it'll generate a new tag for that specific thing. But we also have the ability in our admin section to organize our tags. So we can say, here's a list of everything that's been used so far. Here's how often it's been used, things like that. And then, delete tags, merge tags. Sometimes we'll have something like, I'll have a tag called, Colorado and then one called c o, and it's like, oh, we've actually been alternating which of these we use, but they're all just to, specify that this job is based in Colorado. Merging tags lets us just kind of, more easily, get all of that together instead of having to manually delete one tag and add it to another job, things like that. In our admin section, we also have the ability to limit who can and can't create tags, which I think is usually handy. So if we don't want everyone who has access to tagging a job to be able to create new tags as well, that's where you get a little bit more control over who has this power inside your nullify account. And then, again, once your tags are used, there's a variety of different ways or tags are applied to jobs. There's a variety of different ways to use them. I think one of the quickest, most common ways, most effective ways to use tags is just for filtering inside, this contract jobs page. So, if you're familiar with, a lot of nullify and you're familiar with this main page of contract jobs, you know that sometimes it could get overwhelming. But it has a lot of information where it's giving me profitability, my current cost versus budget. It's giving me revenue calculation. Things like that are all just included, on this page. But let's say I'm only interested in that information, as it pertains to my commercial projects, I can resort this screen to show just the jobs, that are tagged as commercial. But it's not just limited to this screen. It can also be in things like reports. If I wanna run a WIP report, which we'll get to in a bit, I can, say, I want a WIP report for all of my residential projects. Or for the sake of things like scheduling, I can use tags to say, okay. This is a painting job. And then if I have a specific crew that does the painting, I could say, okay. Now filter out the scheduling to just jobs that are tagged as painting. And so you can kinda see that there's a bunch of flexibility here of how we use these things to organize the, the account into the specific ways that we need to see it based off of the tagging of jobs. Now I mentioned that this gets into reporting. Before I get into how are relevant in reporting, because that's gonna be an account wide stuff, I wanna get into the idea of project specific reporting. And so, again, the difference here is I can have reports that are, hey. Across all of my jobs, show me every project and the current outstanding balance. But then inside each job, since we can get more detail, I could say, for this job, show me all the time entries specific to this one that I'm looking at, or show me the current profitability or the contract billing. Things that are very job specific instead of having it be account wide, are available inside each project. So you'll be able to see that, report section, and we'll be able to get, a lot of more classic reports that you'll see on a job by job basis. I always like to say a lot of the screens inside Notify are kind of just reports in and of themselves. So that managed contract jobs table is always a quick way to see cost, to see revenue, to see profitability, things like that. Similarly, inside each project, we can actually see cost, see budget at the phase level, have it broken down into labor, material, subcontractor, etcetera, without us having to download anything. Now we have the reports available, so we do have some that can come out of nullify for review. But, you can never, you oversell how important the actual screens inside Noify are for seeing your progress through a job at any point in time. And, again, when we get into what we'll often call advanced reporting, which is your account wide reporting, this is where we can get into things like our work in progress report, where instead of me saying, okay. What's my current profitability of this one project? I could say, over the course of quarter one of twenty twenty six, how much did I bill out of all of my jobs? How much did I spend out of those jobs? What was the over under billing based off of my classic work in progress calculation? This is where we get that, much more powerful high level account wide reporting. And I never like to call it custom reporting, but this is also where you'll be able to have a little bit more control over the exports that come out of nullify. So, yeah, we do like the work in progress report, but we only wanna see total cost. I don't need to break it down into material, labor, sub equipment. I just wanna see total revenue, total cost. Don't worry about budget. If you need to be more specific like that, you have that ability, and then you can reorganize columns. You can filter out to specific jobs, and this is where things like tags come into, handy, where at the simple level, and I shouldn't even call it simple, but our work in progress report could be a bit overwhelming. Right? It just gives us a ton of data across a ton of jobs. Maybe I'm not interested in that. I wanna say it's like the work in progress report in that it's time based, but I just want job name, revenue, cost, and I just want it across my residential projects. And this is where it's starting to get a little bit more into that custom world, of reporting where I can just tell them if I hear the jobs I'm interested in and the data inside those jobs I'm interested in, and have that sorted out, inside the account. And I I've mentioned a lot of stuff that's job specific, but then we also get into things like individual types of transactions. So I wanna run an invoices report. I wanna run a bills, a purchases, a time report. All of this reporting also lives in this account wide advanced reporting section so that we can get global data, get more high level information that might not be too job specific, and always have the ability to export it in the format that's most relevant to us. Now what I'm gonna do is pull up my account and try to try my best to explain how a lot of this stuff works and show some examples. And then I have a feeling this will be a little bit heavier of a q and a type of section, but I'll start with the concept of tags. So I'm gonna open up my contract jobs page because this is where I like to start these things. And you see that we have this option for show tags available, and I like to zoom in sometimes. Once this is turned on, we'll see that there are tags available, to be added to our job. So project two thirty is already tagged with Denver. Let's say there's another classification. This is commercial Denver. I can add a tag. For project three twenty six, there are no tags yet, and I have the ability to say, like, this is a outdoor job. This is a residential job. But then let's say there's another classification, another type of, you know, item I need to tag to this job that doesn't exist yet. This is where I could say new tag webinar, and that adds a new tag to my account. Now just because I put that in here, again, I can start typing new tag webinar, and it knows to reference the same tag so we don't duplicate when we, don't have to. And, again, I may end up in situations where I accidentally create duplicate tags. I have Denver, and then I have d e n. Maybe I have Colorado as a separate tag, not knowing that I use this one on other projects. Maybe I use some tags that aren't relevant because we can already filter without that. We have a bunch of different cases where we might need to manage these, and that's when we get into the admin section to be able to manage this a little bit more easily without doing it on a job by job basis. But, again, before I even get there, and I don't have to be able to view the tags, to do this, this is where I can now say, you know, show me everything with new tag and boom. This filters out the screen, so I only see the projects that are filtered to new tag. So if I wanna see okay. Give me a high level on all of my Denver jobs. Now I can scroll through and say, okay. This one's doing pretty well. This one oh, I might need to invoice this. Here's one that, yes, I've, invoiced, but clearly, I haven't started work. Here's something that needs some attention. So if I were to get a high level quick snippet of what's going on in my different Denver jobs, using that tag is a great way to do that. I also have the ability to use these types of filters to say, okay. Show me every job that's tagged as Denver, and, I wanna see, Denver projects with a fixed price contract where the, let's just say, work in progress is, over zero. Perfect. Now I could see here two jobs in Denver, that are fixed price and can be invoiced at this point in time. So, again, kind of a little, crossroads of tags and, reporting here. But using filtering, I can get some, more detailed, information on what jobs need my attention at any point in time. Now to manage these tags, I can go to my admin section under customize and then tags, and here's my tag management. Now this is where I could do things like, oops, I created a cost plus tag, but I actually don't need that because jobs already qualify themselves as cost plus. I could delete this. It's not gonna delete the jobs. It's just gonna remove that tag from the jobs. This is also where I could do things like, add new tags without having to add it directly to a job. I see a couple of people raising their hand. We generally don't, actually take people off of mute for these sessions. So if you have questions, just throw them in the q and a, and we'll get to them once we're done. You can see that I also have the ability to choose whether or not only admins can add new tags. If I lock this, then, non admins won't be able to create new tags. If I unlock it, then anyone with access to know if I can create a tag here. This is also where I have the ability to select. So I have Colorado, Den, and Denver. I could say merge these tags, and I just want you to create one new tag called Denver. And it takes every job that's tagged with one of those things and it adds them all under the new tag that we created here. And this way, we have a little bit more organization, get everything synced up without having to overwhelm my account with tags at any point in time. Because I think a lot of the times, having a, simpler set of tags ends up being a a stronger solution. And that's really what I wanted to cover as far as the management of the tags themselves. Again, we could see them, available here. They also do exist in our service jobs. So same idea. I could say, you know, show me jobs that are tagged with, whatever it may be. And when I'm creating service jobs, we have the ability to, apply the tag here and then use that same type of sorting, for this type of project as well. Now I wanna get into my project specific reporting for a moment here. So I'll open up project two thirty here. We have our quick review of our summary page, which gives us high level reporting of today's date right now, what's happening. I can see information, my contract value, my total cost, projected profit, which is gonna be my contract value versus, minus the budget, The current profit, which is our current revenue less, current cost as opposed to our contract versus, our budget, which is projected profit. And then we could see a breakdown with, some high level information here. But if I wanna see more detail inside the project itself, I can go to the plan and track section, and we'll start by just saying, well, we've spent nine thousand, two hundred and seventy five dollars on this project. The budget was ten thousand one hundred and seventy four dollars. And I could see it broke it down into materials versus budget, labor versus budge its budget, and I could see the cost versus budget of each phase here as well. So quick review, way over budget on demo, pretty close on rough in, way under budget on finish right now. But now I wanna learn more. How did I end up so over budget on my demo here? And each of these could have its own cost versus budget reporting that shows me here are the different, costs that we've applied. This is what we had budgeted. Now it makes a lot of sense. I only expected to spend six dollars on materials, and I spent nineteen hundred. Big mistake there. Labor, I said I was only gonna spend a hundred and sixty eight. I spent two thousand two hundred and eighty eight dollars. And so I can start at the high level. We're definitely over budget on labor, but then drill down into here's where we spend way more than we expected, what we actually ended up spending on each different type of, resource, and what type of world they were working in, and just get that idea of, okay. This is what we actually ended up spending so I can, see this information, on the project in real time. Same thing goes for the revenue side of the project. In my contract, the value is worth twenty thousand. We've invoiced seventeen thousand. But to get more detail now, I could scroll through demo is a hundred percent invoiced. Rough in is a hundred percent invoiced. Where I'm not fully invoiced is the CanLight installation change order. It's worth five thousand. We've only invoiced fifty percent of that, and so there's, twenty five hundred dollars outstanding. Now this is all just the in application data that I can grab, but I understand that's not necessarily what everyone's looking for reporting. What I can also do is go to this report section and see a variety of different options that are available, for export from the account. I always like to start with the profit loss. This is one of our more popular things that's available. This is gonna be a very simple breakdown of cost versus budget versus revenue on a project. Now it generates in an Excel document. Gonna give it a second to open up Excel here. But it's gonna give us, to the best of its ability since nothing exactly is nullify, its understanding of nullify, inside an Excel doc. So I could look at this project and see for project two thirty as of March third, here are our budgets, here was our current cost and current revenue, and here's the variance between the two. So I can get that quick p and l to give us the information that we need to understand where we stand on this project as of this, moment in time. Now, again, we're seeing this where it's our revenue is at the overall level, and then our costs are a little bit more broken down. A lot of people are looking for reports that shows cost versus budget versus revenue at the line item level because there's always a potential for there to be a mismatch between the, items in our plan track or phase in, plan track and our items in the contract. It's hard for us to do a direct comparison. It is something we're looking into. We will have something in the, not too distant future. But today, this is a report that could be handy to show me, okay, for demolition, I had budgeted a hundred and seventy four. I've spent, forty two hundred so far. Here's our variance. I could see where I'm doing better and worse, just as a quick review across all of these different, phases in our, contract itself. You know, we, expected to, invoice twenty thousand. So far, we've invoiced this, seventeen seven. Here's our variance, etcetera. Now that's a simple high level one. If we need to just grab, something that's a little bit more nitty gritty, this project summary gives us a little bit more of a, hey. I wanna take everything from nullify on this project and just export it into an Excel document that I can share with someone. We see that summary information of contract value, amount invoiced, budget, cost to date committed, cost to date actual, things like that, resulting profitability. But then we see phase, tabs that break these things down. So here's our cost versus budget at the project level. Here it is now broken down at the phase level with our cost versus budget percentage. And this also can share things like our phase progress. So if you're here for one of our project management webinars where we talk about production tracking, that's where we could compare our progress as the, project manager sees it, completed, compared directly to the cost versus budget that's reported by accounting. So, for instance, this rough in shows a hundred percent complete. This is where, through the interface, a project manager could also say this is a hundred percent complete, or maybe we have a situation where, this phase that is only one percent complete as cost versus budget, we could say, well, it's actually a hundred percent complete as far as the project managers say. So, yes, the we're way under cost, but we don't expect to incur any more cost because according to us, it's now done. So that ends up being a really handy tab as well. Our contract also helps where we could see our list of line items and, the amount that we've billed out of the scheduled value. And then we could have a list of purchases on the job, time entries affiliated with the job, equipments of contractors, our list of invoices. So you can see that this job summary is as named just a summary of everything that's in the job. So I could just grab this out of nullify and hand it over to someone without them having to have access to nullify to learn more about where we stand here. Now, again, we also have a lot of different things that are very project specific that are more precise than just our general project summary. So let's say I need to give someone a breakdown of the billing on a project without giving them all of the cost versus budget and project management information. This is where things like advanced progress billing come into play. So I can actually show someone a report that is just on the revenue side where it's here are your contract lines. This is the value that we agreed on. Here's how much we've invoiced, and this is the remaining balance. So I always think this is a heavy thing to be able to provide to a customer, especially on a long project that's lasting over several months, several years where there's a lot of different agreed upon items. There's a lot of change orders, and they've lost track of what they should be expecting in invoices. Here's a great summary. Let's say I don't send schedule values invoices that break it down per each invoice. This is a great summary to say, hey. Here's where we stand as of today, and here's we can expect to invoice as we move through the life of the project. This also has an invoice resolution that tells us a little bit more about, what's been invoiced to date, as opposed to just, you know, the total balances of the project, but also the invoices themselves that are affiliated with it. Now rather than be clicking into each individual report here, I'm gonna move on to our account wide reporting now, and we'll see that we have this section in nullify that's called reports. And I'm going to start with, the very well named jobs report, which is really the simplest thing we have. Now I like this report a lot because it's a great way to just get data out of my account, based off of the projects that I have, and the criteria that I'm looking for. So what I mean by that is, let's say I'm interested in which jobs I closed in Noify in twenty twenty five. I can come in here and say, custom range one one, twenty five until, twelve thirty one twenty five and apply. So now I'm not just seeing the list of every project that we created in twenty twenty five. I'm not seeing a list of projects that were made active into. I'm actually saying specifically, no. If I please tell me everything that was closed in this time frame, and I can get this list of information. Similarly, maybe I'm interested in, hey. Show me everything that was created in, this. We'll go with another custom time frame. We'll say, created in this year so far. I'm just gonna overkill it to speed up the process here. But not just everything created in this year, but I wanna show everything created that is part of the, Denver office. And now I could see that there are eight jobs that we created this year for Denver. Two of them are closed. Three are active. I have a bidding. I have one that's pending a change order. I could see for the closed projects when they were closed. So the idea here is if I'm trying to ask Nullify a question why I pro about my projects, hey. Show me all the jobs that hit fit this criteria using things like our, jobs report with our tags to filter. I can get a very specific inquiry where I can really start breaking things down. Maybe I use job name too to, understand, different categories, different time frames where I created them. So it's like, show me every project that is created in twenty twenty six, in the Denver office, and the job name has a, triple zero three in it. Now here are all of the jobs that I'm looking for. And that's really the idea is that we should be able to break all this down and filter into more and more detail to see the list we need. And then once this is the data I want, I can export this as well, to get it in an Excel format in case I need additional formulas to run through this. Inside a lot of these advanced reports as well, you'll see this gear icon, which lets me now, dictate what I am, am not interested in, inside this report. So the idea with the jobs report is that it should generically just show a little bit of everything affiliated with jobs. But let's say I wanna be very simple. So I want you to show me this list of jobs created twenty twenty six, And all I'm really interested in is the job name, the client name, the current status, and the contract value. Now this is a quick little report, and it's not gonna be called the contract value twenty twenty six report, but it is a way I can say, okay. For all the jobs created, show me the contract value. And you know what? Maybe I'm interested in that just to see how much different salespeople are making their contracts. I could say throw in the sales lead as well as a column, and then it looks like I haven't been tagging my jobs with sales leads, but this is where I can kinda understand that a little bit more. Similarly, a lot of people are always looking for things like, hey. I wanna be able to quickly see the profitability of my project managers. And I could say, okay. Now this is a report, and I'll turn off my other things. Sales lead and, contract total. Now this is a report that gives me job name, profitability, and, project manager so I can understand this a little bit better too. And then, again, if I wanna run a report, export this into Excel, and then from Excel, do things like average profitability per project manager, run pivot tables, things like that to get the information that I really need out of Notify, that's not necessarily directly in this report. That's where we have a lot more power here. Now this is the idea of the jobs report. If I'm trying to run reports that aren't job specific necessarily, but they give me transaction information, for instance, show me all of my purchases in a time frame. Hey. Show me all of my purchases for, the month of February. We can run these types of reports as well. But this kind of led to us doing something a little bit differently, and you'll see a lot of new reports that are in nullify for this. As much as this is very powerful, purchase is maybe not the best edge. I'll use bills as an example. So, yes, I can show every bill that was logged in the month of February, but the problem with bills is that bills could be against multiple jobs at a time. So I'm gonna try to keep just adding more and more data here. So if I wanna get more detail in this report, right, like, I can't really see based off of this the individual stuff in these bills. That's where we started generating things like the bill items report. So I could say for every bill where the invoice date is inside this year, show me all of the items on these bills, which now gives me the power to see not just the total value and balance of the bill itself, but I can see the item that's in the bill, the quantity, unit cost. We could see what project it's for, what phase of that project. We can get much more granular. So if I wanna say, like, okay. So far this year, I wanna see, every time that Home Depot has billed me for, lumber, The bill item reports oh, well, plumbing has the same thing. I could have been more specific. I could see here's every bill I've received that had the word lumber from Home Depot in this time frame, And this is where we can really start drilling down into the data that exists inside nullified, filtering it out to specifically what we need. Similar to, our other report that I covered, I can now also say, well, I'm only interested in, from this bill, the total cost of the line, the vendor, the vendor type, and the job name. I'm not interested in phase name. Maybe bill status is interesting too. I could say, okay. Now break this down where I wanna see only subcontractor bills. And now I can see in this beer, here's every bill I've received from a subcontractor, and it looks like I gotta pay all of these bills. Here's all of my outstanding amounts and the relevant jobs here. So we can see how these can give us a little bit more power and just kind of help us understand things that require more immediate action inside Notify. Kind of exciting, just timing wise. Similarly, we have the ability with invoices where I could say, show me invoices from, let's just say, December through today. And, yes, we could see their invoices, the project, the outstanding balance, all of this good stuff. I can see by invoice numbers. I can control what is and isn't displayed here. But we've now also launched the invoice items report. So if I'm kinda curious, hey. How much does my company make in, let's just say, demolition. So I'm gonna look at the year of twenty twenty five, and we'll go across the entire year again and say, show me how much I've invoiced every time I've invoiced for demolition. And here's a list across all of twenty twenty five of every time I've invoiced this specific item. Again, I can export it, run some numbers in Excel, try to total things up. But this is a great way I can try to get that detailed reporting and then, again, choose what items are and aren't displayed here. So if I wanted to see well, not just demolition, but every time this project manager has invoiced demolition or this sales lead or I wanna see with this customer how much we've invoiced them demolition. If I need to ask questions like that to my Notify account, we have the ability to get there with all of these updated reports. The last thing I wanna show from these transaction specific reports, are gonna be around time where we have two different options I wanna show here. Number one is my time entries report, which is just about as simple as it can get. Show me all of my time in twenty twenty six so far, where each row is gonna be a time entry, but I can say, like, well, I'm actually only interested in, Terrence's time, and here are all the time entries. And I could say, well, I'm actually only interested in, Terrence's time inside the state of Colorado, and we could just keep drilling down into more and more detail to get the specific information that we need. Now in this case, our time sheet is pretty straightforward. Each row is a single time entry, and I think this is really handy, especially when it comes to things like exporting out of nullify to import into a payroll solution. And what's also nice is that we still have the ability to reorganize. Hey. My payroll actually uses base one hundred, not hours and minutes. We can make those types of changes here. We also have the ability to, again, turn off unrelevant, columns to this. Really just make sure that it's giving us the information we need so we can export it from nullify, and put it into whatever the solution's gonna be. But in a lot of cases, we are finding that, payroll solutions that people were using aren't necessarily requiring a list of individual time entries, but just a summary of hours that were spent inside a time period. So that's what we have, what we call the payroll summary report. So a little bit different from our payroll report itself, and I don't wanna have a time entry per each line of the spreadsheet, I could say, hey. In this year so far, what, how much time has Terrence submitted? Has Charles submitted? How much of it was straight time? How much was it overtime or double time? And then, again, I could choose things like, do we show employee ID or not? Do we show, this in hours and minutes or in base one hundred? But this is where we can get a little bit more control over this and just generate these exports that could be used to place in, into other time, based softwares like our payroll software as we need. So, again, it could be filtered. We have a bunch of different options here. But, for everything we showed here, and I'll say this again at the end, if there's ever times where you could use more filters, more columns to something that makes sense, definitely just let us know, and we can always look to improving these types of reports. I think the things that end up being difficult are when people say something like, oh, I want the payroll summary report that also shows invoiced value per project. So, well, project isn't listed on this report. That's where things might be getting a little bit, difficult. But, again, if we can, really just add it as a simple column that makes sense in the workflow, definitely let us know, and we're always happy to look into that for you. The last report I'm gonna show, because this is kind of the big one that a lot of people are always looking into, is our work in progress report. Now the idea of the work in progress report is that it's not just a list of jobs and their cost to date necessarily, but it's giving us a time frame based report. So if I run the work in progress report, let's just say over the month of February, this is a list of our projects and how much the cost and revenue has changed in the month of February. So let's look at project three twenty eight. The invoiced shows ninety nine hundred dollars here. But that's not saying that we've invoiced ninety nine hundred dollars of this project to date. It's saying in the month of February, we've invoiced that much. So the same project, three twenty eight, if I run this for the month of March, we see invoice zero dollars. So this is my way of being able to say, I wanna see to date where we stand on different projects. And maybe as of today or maybe I shouldn't say today. It's the opposite to what said. But, the idea here is I'm not just saying, show me everything as of today, but I wanna say, okay. I need to retroactively invoice everything we did in January. Show me where we stood as of January on these different projects, and I can get information like cost versus budget. And, again, all of these could be customized. I like to kinda start with things, very off, like, contract total, invoice amount. But you can see how we have the ability to again, I I never like the word custom because it kind of implies that, you know, you name it, you got it, and that's not always the, case. But, this is where we can just break this down and get our list of columns that's relevant to us and our WIP reporting. And I can say, like, okay. In the month of January, here are the projects that we are working on. Here is our budget for each of those projects, the amount we spent. I can see we only actually actively worked on two of these jobs, and we actually didn't create any invoices, which is its own problem. And then, again, all of this can, be filtered as well. So if we need to add additional filters and get the specific projects we're interested in, we have that power. So let's just say I'm now interested in, the work in progress across, our Denver jobs. This is gonna give us some more information based off of what I want here. Now the other reason I want to bring up work in progress is that work in progress has a a couple different meanings when it, comes to nullify and really the industry, in general. Because we're not just looking into the idea of our cost within a period, but also our over and under billing in a period. So what we mean by this is if I'm comparing the amount of the contract I've invoiced to the amount of the budget I've spent, have I invoiced the same percentage, more of a percentage, less of percentage? So I could see this positive value here is saying, well, in the month of January, on project two thirty, even though the contract value is worth twenty thousand, you didn't invoice anything. The budget's ten thousand dollars, and you spent ninety six dollars of that. That is point nine four percent of the budget, but I never invoiced. So it's saying you should be good to invoice point nine four percent of the contract value. You have underbilled one ninety one seventeen on this. And that's the idea with our over and under billing, which you'll often see labeled as whip throughout the system. If I look at project two thirty, here's my current work in progress, seven hundred and eight dollars and fifteen cents. And if you're ever curious about where this number comes from, you can click on this view details. My total budget is ten thousand of which we've spent nine thousand. That's ninety percent of the budget. The contract's worth twenty thousand, of which we've invoiced seventeen thousand, that's eighty seven percent of the contract value. The resulting amount that I should be set to invoice is, seven hundred dollars. Now just to kinda see this move, for the sake of explanation, positive WIP, again, means that we have underinvoiced or overspent depending on how you look at it. So if I now go in and invoice this project for, let's just say, the remaining balance of it. Now I could go see that job again, same exact project that we just were working with, and my whip is going to adjust itself into a negative because now I've completely invoiced the project, but I'm still under, budget. So it's like, hey. Yes. You have invoiced twenty thousand dollars, but just understand that you have invoiced seventeen hundred dollars more than expected based off of your cost to date. It's not a bad thing. It's just a way of us, if nothing else, adjusting our expectations. So we don't always look at the current profit as if it is true to word, a hundred percent the way that we are gonna land at the end of the project. It helps protect us in situations where we have, let's just say, a up assigning invoice before we started too much work on the job. So let's just say I have a project that I've invoiced ten thousand dollars for, but I budgeted way more than that. My only cost so far is five dollars of a, whatever it's gonna be, a widget and a gas station, anything. I don't wanna look at this and say, like, wow. I've made ten thousand, I forget the number I said, and only spent five thousand. I'm doing great. We use the WIP number to say, like, yes. You have made way more than you've spent. But based off of the budget, be ready to spend more over the life cycle of the job. And that's where these numbers really come in handy. I've rambled for much longer than I expected I would, but we do still have fifteen minutes scheduled, and I saw some questions come in. So I'm gonna start doing my best to chip away at those, starting with, can you have show, show tags permanently checked? Not at this point in time. That's a really good bit of feedback, though. I think, we can look into having that as a setting in the future. When in doubt, always throw your feedback in here. I know that it can sound a lot or feel a lot like, screaming to the void. I'm trying to get better about responding to these. It it does become a bit of a cluttered system that needs some cleanup. But, again, never be shy about that because it helps us understand what to make next. What report will one run to see which invoice payments are showing up as QuickBooks payment merchant fees? If it's so we don't have anything that runs reports on payments yet at this point in time. If you're talking about having a a report on the individual lines, the, like, Intuit payment fee line, that's where I would be able to say invoice items report. And I I don't use merchant services in this test account, but just for the sake of example, we could say, item description includes processing fee. I forget how we label it. And then using that, it should filter out to all of those individual instances. So that should be something that can help you out in those cases where you're trying to run those numbers. There was a question about, the project summary report excluding taxes. I think that's this is a good question. So it won't be relevant to this account because it's in the US. But if you're outside the US, under your tax rate section, you could choose whether or not you want, taxes to be included or excluded as part of job costing. I believe that's what ends up affecting the report itself, too. So if you, are finding that the tax rate is not showing in that report and needs to, I recommend you double check this section and whether or not you've chosen for it to be included or excluded in that report, based off of the settings. There's a request to run through the report of phases. Now this is a a report that I always like a lot. I think it gives a lot of power. So, I mentioned the idea of, like, we can have a bill report, but then sometimes I wanna get more detailed, look at each line of the bill. So, similarly, I can look at a jobs report, but sometimes we wanna get more detailed look at the phases of a job. And that's where we have this phases report. Now, again, this has a bunch of different filtering options to make sure that we could see the specific phases that we're interested in. Now the question here, our superintendent inputs the percentage of completion, but when we run the report, I'm not seeing that data reflected. So this could be that you're just running into a bug, but I just wanna do something like, show me jobs that are, active, get a little simpler here. And there should be the ability to see progress, max progress, unit of measure. Beautiful. So I could see let's pull up one of these jobs as an example. Project three twenty two. The phase is called no item for whatever reason, and I'll just set some phase progress here. Because we did mention this concept of I'm use percentage. This is pretty straightforward. And then here's the no item one. We'll make this one custom units. I did mention when we went over project summary, the benefit of seeing cost versus budget next to the amount of phase progress. So same idea here where I could say, add some progress, fourteen percent, and give me while I rush through putting in some junk data here. Now we'll go back to our phases report, and I wanna filter back to active jobs. And we should be able to see here is the specific one that we're just working with. Let me just confirm three twenty two. Job status and job name is three twenty two. And here's where I could see progress, fourteen out of a hundred percent, a hundred and sixty four out of two hundred thirty five units, and we could see that percentage of completion from a project management standpoint. And then, again, if we need, we can also see that next to our cost versus budget. So if I wanna see total cost, total budget, but then things like I don't care too much for all of my category based cost, now I could see, our cost versus budget in a little bit more detail right next to our phase progress on these. Now the report, the date range here is based off of when the phase was actually added to Noify. So if you're seeing that phases are in the report itself, you might need to just open up the date range a little bit more, which was the follow-up part of this. So what date is the report actually pulling from? So that would be kind of the difference here. And then, again, if you're still running into issues beyond what we covered here, definitely let us know. We're always happy to look into it. It looks like it helped. Nice to kinda thank you. We use PO numbers for jobs. Would it be possible to create a PO section in contract jobs overview? We use our tag we use tags for our POs, but it's costly. I have to delete them as there's a limited number of tags. So, one thing you we should be able to do, and I I don't wanna say we could do it today because I don't think we do. But every job in Noify has a field for PO number. I have a feeling it's not available yet. Cool. So for instance, let's take a look at project three twenty one. In our contract, we have PO number. Now this is kind of a something I mentioned based off of feedback earlier. If you needed to have that in this jobs report and say, like, okay. Now include that PO number. That's something we should be able to do for sure. So definitely put in a request with our team and see if that's something that ends up helping out, in your specific use case. It's a good question. It's a good bit of feedback if that helps. If it doesn't help, again, definitely reach out to me or our team just so we can clarify and make sure we find the best path forward. But definitely something that, we can look into, and I bet you we have a solution that can work great for your need. Mapping phases to QuickBooks revenue streams can get missed option often as possible. Use tags to map revenue streams in QBO. Excellent. So so in your nullify mapping section, sorry, QuickBooks mapping sections at nullify, under job defaults, you can assign a class and location to each job. So if I use classes or locations for revenue streams for things like commercial, residential, company one, company two, things like that, well, we could set this up here. But what I could also do is connect my tags to these different classes. So my account now knows if I tag something with Denver, it uses the Denver location. If I tag it with New York, it uses the New York location. It always uses the most recent information it has. So for instance, if I look at, project two thirty, which is set to Denver, but then I were to come in here and say, retag this with New York. Technically, it has both tags. How does it know? Whichever word it uses most recently is gonna, win out here. So now going back to my mapping, under job defaults, project two thirty set to New York instead. But that's the way that I can use tags connect to our QuickBooks mapping to say, hey. When I tag it with commercial in Noify, I would like you to make sure that everything goes to the commercial class in QuickBooks moving forward. And then is there an option to save your filtered reports to regular use? Not today, but that is actively being looked into for by our development team and design team. So, hopefully, that's something that is going to be coming in the not too distant future. And then can we run reports where we break down the data month by month? Not necessarily broken down month by month, but when we're running our work in progress report, since I can specify the start and end date of this, what I would effectively do is just run it for each month to say, like, okay. Show me January, February, March, and get all that reporting broken down. That is the last of the questions. I really appreciate everyone tuning in. We had a a great audience, a great amount of q and a, and this is about the longest we've ever gone on one of these webinars. So I hope I didn't bore everyone. I know talking about construction specific accounting reports isn't always the most exciting thing to do on a Tuesday, but I hope you learned something. I hope I was helpful. And if you have any feedback on where I can do these webinars better in the future, if you have more stuff you'd like to learn about, just let me know, and I'm happy to help out. Thanks, everyone, again, and I hope you have a great rest of your week. Take care.